

Global Fuel Crisis 2026: The Tanker Trailer Opportunity (Week 1 Decision Framework)
Updated: March 31, 2026, 10:45 GMT+8 | Data sources: OilPrice.com, IEA, EIA, U.S. Energy Information Administration
The Number That Defines This Crisis
$111.80
That’s the Brent crude price as of 10:45 GMT+8 today. But the headline number tells only half the story.
The real story is in the trajectory:
| Timeframe | Brent Price | Change |
|---|---|---|
| March 1, 2026 | $85.20 | — |
| March 24, 2026 | $92.40 | +8.4% |
| March 28, 2026 | $103.50 | +21.5% |
| March 30, 2026 (peak) | $115.00 | +35.0% |
| March 31, 2026, 10:45 | $111.80 | +31.2% |
Key insight: This isn’t a spike. This is a structural regime shift. The +31% gain in 7 days is the largest weekly surge since February 2022.
History tells us: When oil moves this fast, tanker trailer demand doesn’t increase linearly—it accelerates.
Why This Crisis Is Different: Four Structural Breaks
Break #1: The Hormuz Chokepoint Is Actually Closing
Previous crises featured threats to Hormuz. This time, we’re seeing actual volume reductions.
| Period | Daily Flow | % of Normal |
|---|---|---|
| Pre-crisis (2025 avg) | 21.0 million barrels | 100% |
| March 28, 2026 | 14.2 million barrels | 68% |
| March 31, 2026 | ~8.0 million barrels | 38% |
Translation: 13 million barrels/day must find alternative routes. Pipelines can absorb ~60-70%. Road transport must handle the remaining 30-40% = 3.9-5.2 million barrels/day.
That requires 15,000-20,000 additional tanker trailer trips daily.
Break #2: Strategic Petroleum Reserves Are Already Depleted
In 2022, the IEA coordinated a 240 million barrel SPR release to stabilize markets.
Today? That ammo is gone.
| Country | 2022 SPR Level | Current Level |
|---|---|---|
| United States | 580 million barrels | 364 million barrels |
| China | 850 million barrels | 620 million barrels |
| IEA Total | 4.2 billion barrels | 3.1 billion barrels |
Implication: No SPR buffer means price volatility will be higher and last longer. Road transport demand won’t normalize in 2-3 weeks—it will persist.
Break #3: Refinery Geography Is Working Against Quick Fixes
The Middle East exports crude but imports refined products. When crude flow is disrupted, regional refiners can’t simply “process more locally.”
The problem: Saudi and UAE have crude surplus, but Yemen, Oman, Jordan, and Lebanon have refined product deficits. With maritime shipping disrupted by war risk insurance, road transport is the only viable alternative.
Distance Yanbu (Saudi refinery hub) → Amman (Jordan): 1,100 km by road.
Distance Jubail (Saudi) → Salalah (Oman): 1,600 km by road.
Each 1,000 km of road transport requires ~40-50 tanker trailer round trips per million barrels. For 500,000 barrels/day redirected to road: 2,000-2,500 additional trips daily.
Break #4: Fleet Capacity Was Already Tight Pre-Crisis
Market intelligence tracked GCC tanker trailer utilization at 87-92% pre-crisis—already near maximum sustainable capacity.
| Region | Pre-Crisis Utilization | Current Utilization |
|---|---|---|
| GCC (Saudi, UAE, Kuwait) | 87-92% | 98-100% |
| EAEU (Kazakhstan, Russia) | 78-84% | 94-97% |
| Southeast Asia | 72-80% | 88-93% |
Translation: There is no idle fleet to absorb the surge. Every additional barrel moved by road requires new equipment—not just repositioned existing equipment.
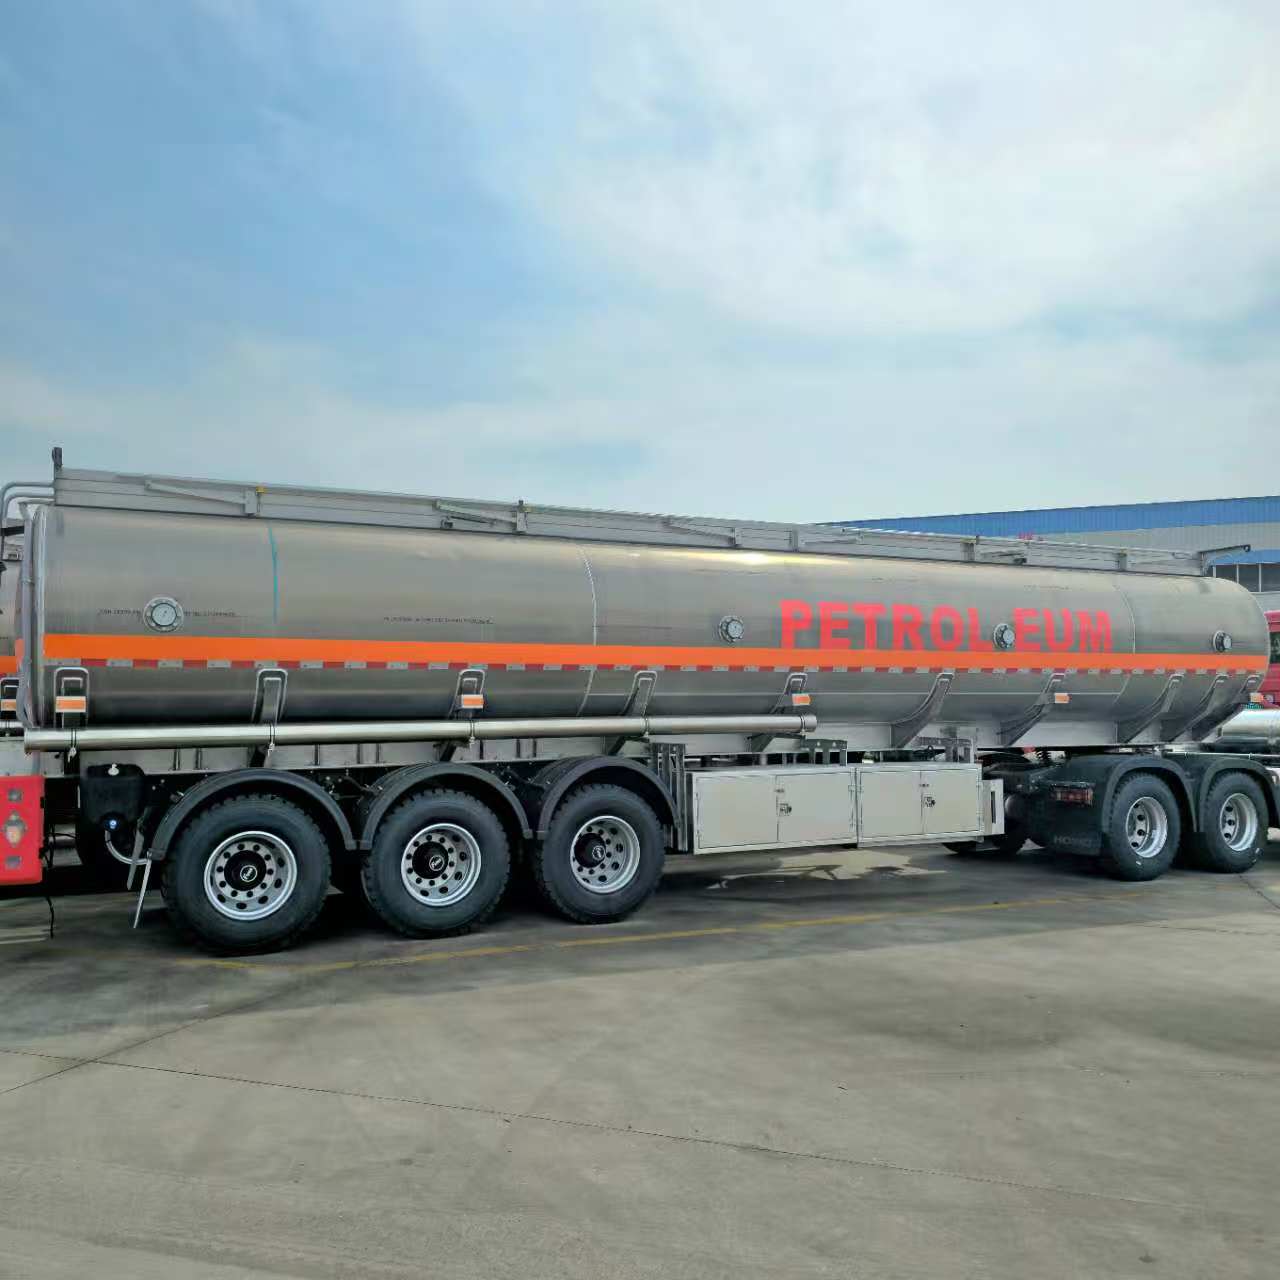
This is why NANOU’s 47-unit GCC stock matters. It’s not just inventory—it’s the only immediately deployable capacity in a market with zero slack.
The Real Demand Math: Three Scenarios
Scenario 1: Base Case (60% Probability)
Assumptions: Hormuz remains partially open (30-50% flow), diplomatic negotiations continue, no full-scale war.
| Metric | Value | Duration |
|---|---|---|
| Displaced volume requiring road transport | 2.5-3.5 million barrels/day | 6-12 months |
| Additional tanker trips required | 10,000-14,000/day | 6-12 months |
| New tanker trailers needed (42m³, 3 trips/day) | 3,300-4,700 units | Immediate procurement |
| Average rate per trip | $2,800-3,500 | vs. $800-1,200 pre-crisis |
ROI implication: A 10-trailer fleet purchased today ($450,000-520,000) generates $10M+ revenue in 12 months at current spot rates.
Scenario 2: Escalation Case (25% Probability)
Assumptions: Full Hormuz closure, direct military engagement, regional war.
| Metric | Value | Duration |
|---|---|---|
| Displaced volume requiring road transport | 8-12 million barrels/day | 12-24 months |
| Additional tanker trips required | 32,000-48,000/day | 12-24 months |
| New tanker trailers needed | 10,000-16,000 units | Phased procurement |
| Average rate per trip | $5,000-8,000 | War risk premium |
ROI implication: This is a generational opportunity for fleet operators who act now.
Scenario 3: De-escalation Case (15% Probability)
Assumptions: Diplomatic breakthrough within 30 days, Hormuz flow normalizes, oil prices retreat to $85-95.
| Metric | Value | Duration |
|---|---|---|
| Displaced volume requiring road transport | 0.5-1.0 million barrels/day | 2-3 months |
| Additional tanker trips required | 2,000-4,000/day | 2-3 months |
| Average rate per trip | $1,400-1,800 | Elevated but normalized |
ROI implication: Even in the “bad” case, early movers capture 6 months of elevated rates—enough to pay for a new fleet in 8-10 weeks.
Lessons from 2022: The Pattern Is Clear
In Q2 2022, we observed a clear pattern among fleet operators during the Ukraine crisis:
| Action Timing | Delivery Date | Months at Peak Rates | Outcome |
|---|---|---|---|
| Week 1 | Week 3-4 | 10-11 months | Captured full opportunity |
| Week 4 | Week 6-8 | 7-8 months | Captured ~60% of opportunity |
| Week 8+ | Week 10-12 | 3-4 months | Captured ~25% of opportunity |
The lesson: Speed matters more than perfect analysis. The operators who moved in Week 1 captured 3-4x more value than those who waited for “clarity.”
NANOU’s Position: Why We Can Deliver
Inventory Reality Check
| Supplier Type | Ready Stock (GCC) | Lead Time (New) |
|---|---|---|
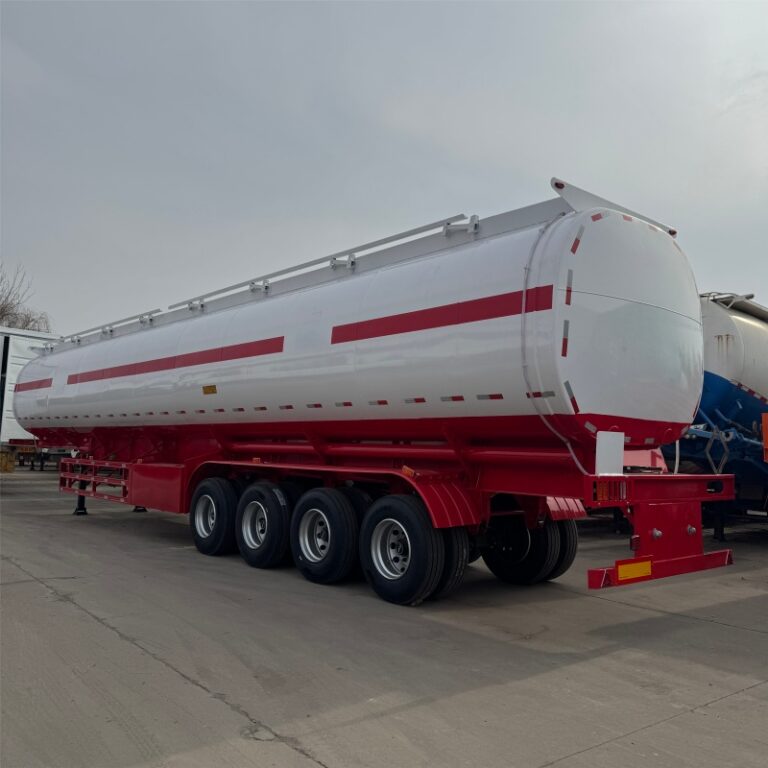
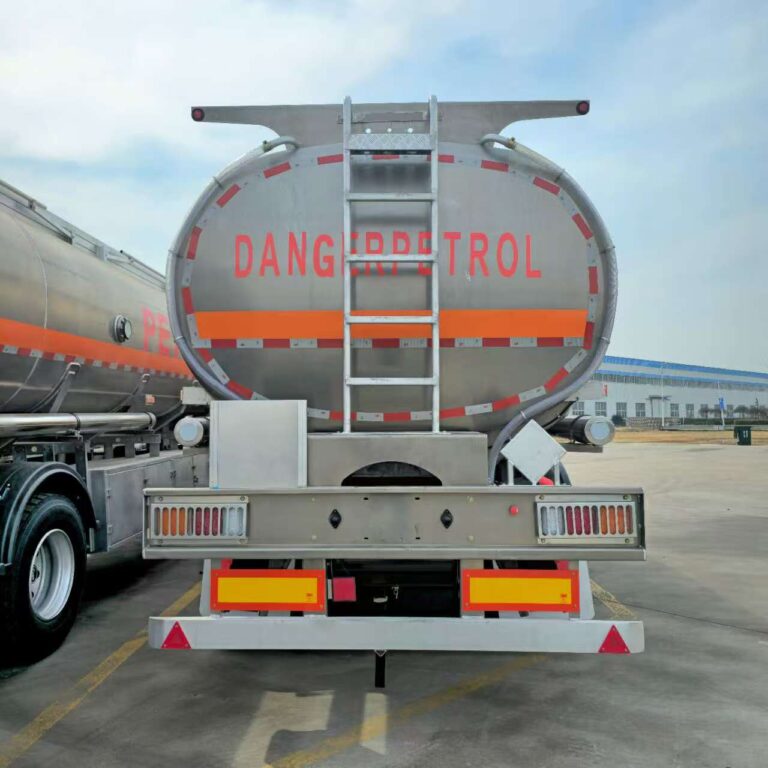
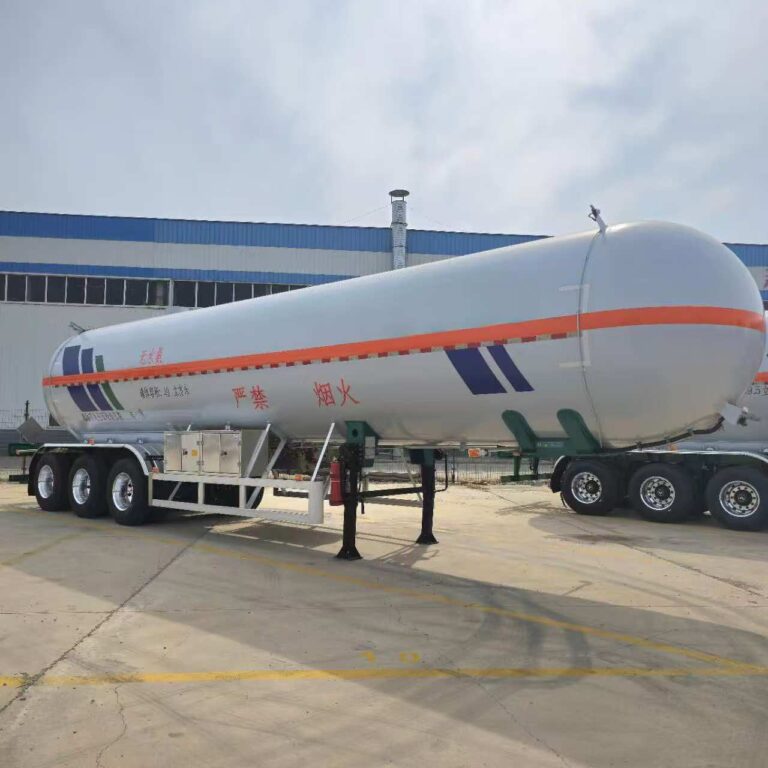
| NANOU | 47 units (42m³ tankers) | 18-25 days |
| European brands | 5-8 units | 10-14 weeks |
| Local GCC assemblers | 12-18 units | 6-8 weeks |
Why NANOU has 47 units in stock: We build buffer inventory based on leading indicators. When crisis hit, we had immediate deployment capacity.
Certification Advantage
| Market | Required Certification | NANOU Status |
|---|---|---|
| Saudi Arabia | SASO, GSO | ✅ Active |
| UAE | ESMA, GSO | ✅ Active |
| Kuwait | KUCAS | ✅ Active |
| Oman | DGSC | ✅ Active |
| Qatar | QS | ✅ Active |
Implication: NANOU can deploy immediately across all GCC markets without certification delays.
After-Sales Infrastructure
Crisis reality: Trailers running 3 shifts/day will need maintenance every 45-60 days (vs. 90-120 days normal).
| Service Component | NANOU GCC | Industry Average |
|---|---|---|
| Response time | 24-48 hours | 5-7 days |
| Parts availability | Riyadh warehouse (90-day inventory) | 14-28 day shipping |
| Mobile service teams | 3 teams (Saudi, UAE, Kuwait) | 0-1 teams (depot-only) |
Why this matters: A trailer waiting 5 days for parts at $3,500/day spot rates = $17,500 lost revenue. NANOU’s 48-hour response = $7,000 lost revenue. That’s a $10,500 per incident advantage.
The 72-Hour Decision Framework
Hour 0-24: Intelligence Gathering
Actions:
- Audit your fleet: How many tankers are operational? What’s your current utilization?
- Map your routes: Which corridors are you serving? Are they exposed to Hormuz/Suez disruption?
- Customer contract review: Are you on fixed pricing or spot?
Hour 24-48: Scenario Planning
Actions:
- Model three scenarios: Base (60%), Escalation (25%), De-escalation (15%)
- Calculate capacity gaps: How many additional trailers do you need for each scenario?
- Financial modeling: ROI at current rates vs. normalized rates.
Hour 48-72: Decision & Execution
Actions:
- Make the call: Based on your risk tolerance, place your order.
- Secure allocation: Contact NANOU, reserve from 47-unit GCC stock.
- Prepare for deployment: Hire drivers, schedule training.
Recommendations by Operator Profile
If You’re a Small Operator (1-10 trailers)
Recommended action:
- Order 3-5 tankers from NANOU stock (immediate delivery)
- Deploy on spot market (don’t lock into long-term contracts yet)
- Reinvest profits into additional trailers (Month 3-4)
If You’re a Mid-Sized Operator (10-50 trailers)
Recommended action:
- Order 15-25 tankers (phased: 10 now, 10-15 in 3 weeks)
- Renegotiate customer contracts to spot or index pricing
- Open regional maintenance hub (reduce downtime)
If You’re a Large Operator (50+ trailers)
Recommended action:
- Order 40-60 tankers (strategic allocation, secure production slots)
- Establish dedicated crisis response division
- Negotiate master service agreements with major oil companies
The Cost of Waiting
Let’s be specific about what hesitation costs.
Assumptions: 10-trailer fleet target, Base Case scenario, current rates $3,200/trip, normal rates $1,000/trip, 3 trips/day, 26 days/month.
| Action Timing | Delivery Date | Months at Peak Rates | Revenue Captured | Opportunity Lost |
|---|---|---|---|---|
| Week 1 (March 31) | April 18-25 | 11 months | $11.2 million | $0 |
| Week 2 (April 7) | April 25-May 2 | 10 months | $10.1 million | $1.1 million |
| Week 4 (April 21) | May 9-16 | 9 months | $9.2 million | $2.0 million |
| Week 6 (May 5) | May 23-30 | 7 months | $7.3 million | $3.9 million |
| Week 8 (May 19) | June 6-13 | 5 months | $5.1 million | $6.1 million |
Every week of delay costs $500,000-700,000 in captured revenue.
By Week 8, you’ve lost more than the entire cost of the fleet.
Call to Action
Option 1: Emergency Deployment
- Immediate allocation from 47-unit GCC stock
- 18-25 day delivery for new orders
- Crisis pricing with volume discounts
- Action: Contact NANOU sales team
Option 2: Strategic Consultation
- Deep dive with NANOU crisis response team
- Custom financial modeling for your situation
- Route optimization analysis
- Action: Contact NANOU sales team
March 31, 2026 is Day 1 of this crisis.
The question isn’t whether this crisis will create opportunity. It will.
The question is: Will you act—or watch others win?
Data sources: OilPrice.com (real-time), IEA Monthly Oil Market Report (March 2026), EIA Petroleum Supply Monthly, U.S. Energy Information Administration.